Ever felt like you’re flying blind with your AWS infrastructure? You’re not alone. Many developers and DevOps engineers have been there, trying to figure out why their applications are running slow or why their bills are suddenly skyrocketing. That’s where AWS CloudWatch comes in – think of it as your mission control center for everything happening in your AWS environment.
What is AWS CloudWatch, Really?
CloudWatch is Amazon’s answer to the age-old question: “What’s happening with my applications right now?” It’s a monitoring and observability service that gives you real-time insights into your AWS resources, applications, and services. But don’t let that technical description fool you – it’s actually pretty straightforward once you get the hang of it.
Why Should You Care About AWS CloudWatch?
Let’s get real for a moment. You’re probably thinking, “Great, another tool to learn.” But here’s why CloudWatch is worth your time:
- Cost Savings: Imagine getting an alert before your AWS bill goes through the roof because someone forgot to terminate those expensive instances.
- Peace of Mind: Sleep better knowing your applications are being monitored 24/7.
- Problem-Solving Superpowers: Find and fix issues before your users start complaining.

The Core Features You Need to Know
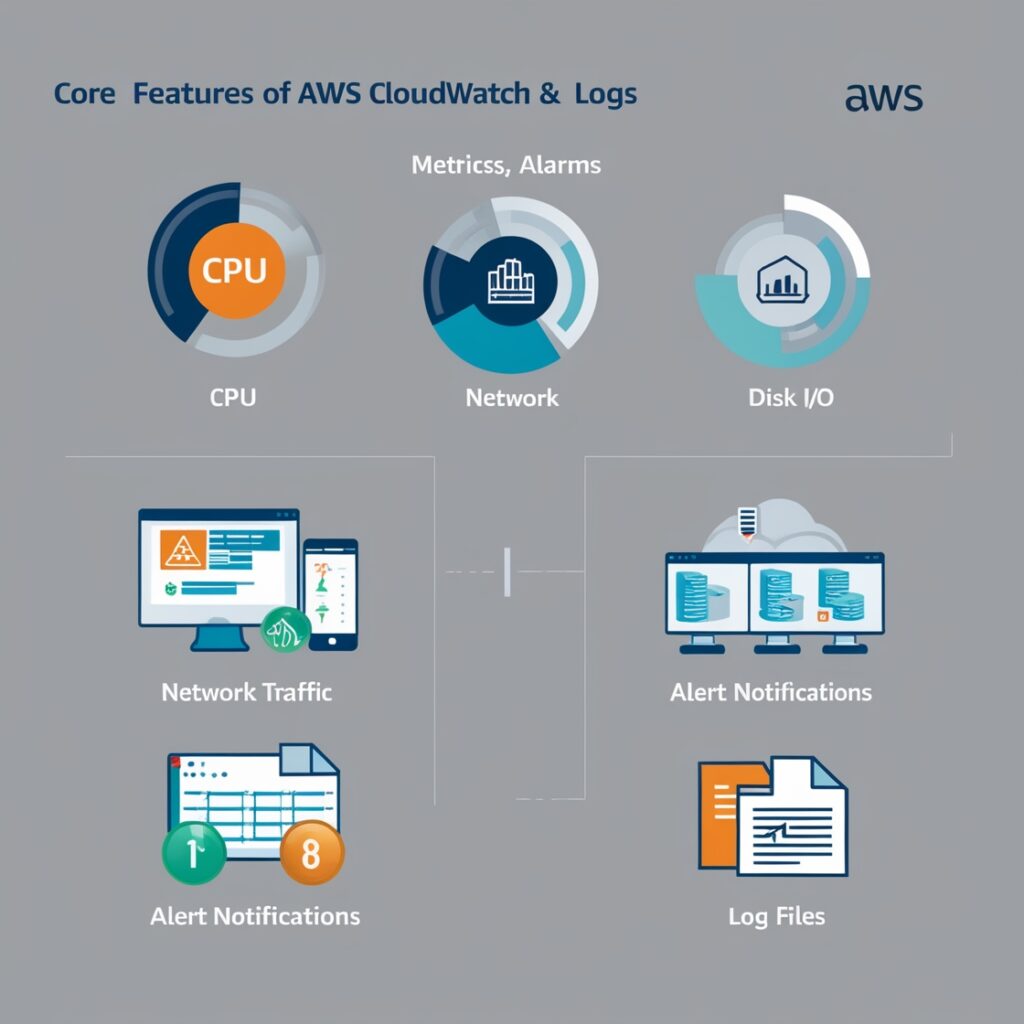
Metrics: Your Digital Dashboard for AWS Cloudwatch
Think of metrics as your application’s vital signs. CloudWatch automatically collects data about:
- CPU usage
- Network traffic
- Disk I/O
- And dozens more
Here’s a practical example: Let’s say you’re running an e-commerce site. You could track:
- Number of orders per minute
- Shopping cart abandonment rate
- Payment processing time
- Server response time
Alarms: Your Virtual Assistant
Alarms are like having a super-attentive assistant who never sleeps. Here’s a real-world scenario:
if (CPU_Usage > 80% for 5 minutes) {
    send_alert_to_team();
    auto_scale_instances();
}
This simple setup could save your application from crashing during a traffic spike!
Logs: Your Digital Detective
CloudWatch Logs is where you become a detective, solving application mysteries. Instead of digging through multiple servers, you get a centralized place for all your logs.
For example, tracking a user’s journey through your application might look like:
2024-03-15 10:15:23 - User logged in
2024-03-15 10:15:25 - Added item to cart
2024-03-15 10:15:30 - ERROR: Payment processing failed
Getting Started: Your First CloudWatch Setup
Let’s create your first meaningful CloudWatch monitor. Here’s a practical example that anyone can follow:
- Set Up Basic Monitoring:
- Log into AWS Console
- Navigate to CloudWatch
- Create a new dashboard named “MyAppHealth”
- Add Your First Metric:
   - Select EC2 from the metrics list
   - Choose "CPU Utilization"
- Add to your dashboard- Create Your First Alarm:
   When: CPU Usage > 80%
   For: 5 consecutive minutes
   Then: Send email notification
Pro Tips That Nobody Tells You About
- Custom Metrics Are Your Friend
Don’t limit yourself to AWS’s default metrics. Create custom ones for business-specific needs like:
- Daily active users
- Revenue per hour
- Error rates by feature
- Use Log Insights Wisely
Instead of scrolling through endless logs, use CloudWatch Log Insights to query your logs like a pro:
   fields @timestamp, @message
   | filter @message like /ERROR/
| limit 100- Dashboards Are Your Best Friend
Create role-specific dashboards:
- Developer Dashboard: Focus on application performance
- Business Dashboard: Focus on user metrics
- Operations Dashboard: Focus on infrastructure health
Common Pitfalls to Avoid
- Don’t Over-Alert
Alert fatigue is real. Start with critical alerts only and gradually add more as needed. - Watch Your Costs
CloudWatch can get expensive if you’re not careful. Use these tips:
- Set up basic monitoring where possible
- Use log sampling for high-volume applications
- Regular clean up old logs and unused dashboards
Wrapping Up
AWS CloudWatch isn’t just another monitoring tool – it’s your window into the health and performance of your entire AWS infrastructure. Start small, focus on what matters most to your application, and gradually expand your monitoring as you grow more comfortable with the platform.
Remember, the best monitoring setup is one that helps you sleep better at night, knowing your applications are running smoothly and your users are happy.
Ready to take your AWS monitoring to the next level? Start with the basics we’ve covered here, and you’ll be a CloudWatch pro before you know it!
Pro Tip: Keep this guide handy as you start your CloudWatch journey. The best way to learn is by doing, so go ahead and set up your first dashboard today!
Next: Mastering AWS AppSync: The Ultimate Guide to Crafting Scalable and Dynamic GraphQL APIs


1 thought on “AWS CloudWatch: Your Complete Guide to Cloud Monitoring”